
EuroPython 2022: Summaries of selected talks
Day 1
Python's role in unlocking the secrets of the Universe with the James Webb Space Telescope
keynote speaker: Dr. Patrick Kavanagh
First James images were released this week. 90% of the analysis tasks are performed with Python. James is a pure infra red telescope with a big mirror to find the earliest stars in the universe. If you want to observe heat you need to keep the telescope really cold. Launched in December 25th 2021, worst Christmas day ever, due to anxiety. Ariadne did a great job saving the fuel on the satellite extending its expected life from 10 to 20 years.
Images need quite a bit of processing to get the nice end results, due to detector effects. We need to remove all the telescope and detector effects. This is the main goal of the instrument teams using data pipeline called the calibration pipeline. A series of steps to remove artifacts sequentially. Artifacts are removed based on calibration files that are human curated and improved incrementally.
Everything is build in Python in a private github repo to commission the Miri instrument and the process for the other instruments is the same. You do not want all the scientists to do this calibration and filtering. We provide a python science software package supporting 17 science modes detected based on image metadata. This automatic pipeline is called the JWST calibration pipeline implemented with Python (with C plugins), which is publicly available.
Why Python? There is substantial experience with python in the astrophysics community. It easier to maintain across instruments reusing the same framework. Modular build through Python classes. Developed in the open. Offline pipeline support to run on your own machine for debugging and development with support for pause and rerun. Data stored in the FITS standard with a lot of metadata about the observation. It presents developers a common framework for steps/pipelines. All of this is based on stpipe (python package). We have classes for pipeline step and pipelines. handles everything based on the metadata in the raw data, data in and output, calibration file retrieval, artifact removal, logging, etc.. Data transformation is implemented in a separate method in the step class, which is implemented by assigned scientists. All other data handling and loading is handled outside of this method, which is implemented by engineers.
We needed to test our pipeline with relevant test data. For this we needed simulators to create representative raw data. This was all done in Python. The goals was to reconstruct the observation of a known celestial object based on simulated data.
Biden revealed the deepest image of a section of the star field in captured 12 hours compared to weeks for Hubble. It shows gravitational lensing on a galaxy. galagaxy from 13 billion lightyears ago. Galaxies are visible that are visible in Hubble pictures, due to their distance and redshift. The diffirent instruments support each other with MIri doing the very long wavelength dynamics of interstellar medium and early galaxies.
Making Python better one error message at a time
speaker: Pablo Galindo Salgado (Python core developer)
Syntax errors are shown on lines where the error was not caused. Mostly it points to line further down from where the syntax error was made. For instance "SyntaxError: unexpected EOF while parsing". How do you explain this? We need to improve this in the interpreter to support current and new users. Let me show you some of the improvements we made. We replaced the complete parser and the new one is called PEG parsers which is 30 years newer than the old LL(1) parser from 1990. Replacement of the new parser provided new grammar such as the "match" statement, which is more popular than reddit would make you believe. The PEG parser is not inherently bad, I want to show that you can do cool things with the parser, such as improving the error messages.
For instance, if you have a missing column to close a block or you miss a value in a dictionary, these now gives you contextual SyntaxErrors with error messages that make sense instead of funky misplaced SyntaxErrrors. So, everyone wins. Adding these error messages is hard :( As a human you know what you want to do, but the parser tries to understand what you want to write and might extend this into guessing what you want to do. This guessing is very hard on top of the challenge of generating good error messages in general.
```
x = [x, y z, w]
>> SyntaxError: Perhaps you forgot a comma
```
A simple matching rule does not work because a missing value in a dictionary would also print "Perhaps you forgot a comma". Same as a lot of other edge cases, plus the match case breaks because it has two names separated by a space. Here is my issue tracker, which shows that I learned the hard way that error message rules are hard. The syntax checker also became slow in edge cases with exponential backtracking on nested braces.
Now that we have a lot SyntaxErrors covered we are moving our attention to Runtime suggestions. Runtime suggestions are errors and issues that are detected at runtime. Comparisons with Rust are not fair, because most of their error messages are generated during compile time instead of runtime. In Python, if you want to access an attribute on a Tuple it suggests you to use a NamedTuple. Same for non-existent object attribute access. The challenge is to generate these errors only if the user actually made a mistake instead of expected behavior where an AttributeError is catched and passed. Otherwise, it would make code execution very slow in normal expected cases. The way we do it, there is a function print_exception when an exception is at the top level with no handlers. This C functions does a couple of steps, including print exception suggestions. At that stage we can take a bit more time to do our computation.
A related improvement is better granular messages on complex Python expressions where one of the objects is None, but you do not know which. This used to be totally unclear and you had to guess. Now we have clear error messages and point out the object that is of NoneType. To do this we use Binary code instructions. When the error happens we extract the code that causes the error. We put hard work into it to produce positions in the code finding the position of the instruction that is failing and reconstruct the source code position based on the binary instructions. These source code positions are printed in the error messages to give a good idea where the error originates.
How can people help us make the interpreter smarter? We have a guide to CPython's Parser, it is not for everyone, but it explains how to add new grammers and explains how the new PEG parser works. It also explains how you can add new error messages. There are now contributors opening Pull Requests to add error messages to unclear errors in the python interpreter. Disclaimer: we may have to decline your pull request because it makes Python unstable or trigger a lot of side effects. The moral of the story is that you can go from unlcear error messages to spending two years to become a Python core developer and improving the error messages, while doing a PhD.
Codebeez response: I am excited about these improvements in Python 3.11, I have lost quite some time with unclear error messages by the Python interpreter. Exactly those classes of errors improved by the work in this talk. Thank you to all the Python core developers involved.
Python & Visual Studio Code - Revolutionizing the way you do data science
speaker: Jeffrey Mew (product manager at Microsoft)
We started later due to technical difficulties. Jeffrey works at Microsoft and wants to show us how Python + VScode can revolutionize the way you do Data Science. We start with a demo project about salaries and skill levels to predict the expected salary in tech. We break it down in data exploration/cleaning, model training, and productionization. There are features in visual studio code to improve the boring work. Let us look at data exploration, for the stackoverflow survey dataset. We need a VSCode extension for Python, which includes the notebook functionality. We will go through the notebook as we read the data and look at the data. One of the biggest downsides with notebook is the variable state that is hard to manage, we have a jupyter:variables tab that shows our variables. We have some ideas in the works for variable dependency management, but nothing confirmed yet.
Introducing data wrangler
When we look at large number of columns, jupyter truncates the column display. This is not convenient as the output needs to fit in a cell. To improve this we have some non interactive views currently in VSCode. I introduce Data Wrangler, which is a UI for data cleaning in VSCode, which has not been released yet. Data Wrangler is a free data cleaning and processing tool, that does its work in the background. This is the first public showcase of it, we have been working on it for some time. We get a data overview with column info and a context menu with operations on the data. Such as filtering the data. Data wrangler would highlight the columns it would filter and generates a pandas statement that allows us to keep code as our source of truth. Each operation is generated into a separate jupyter notebook cell, which makes the steps reproducible and isolated. When we are finished we click on export code to notebook which combines the various steps into a function which accepts a dataframe and spits out cleaned data. There is some basic data visualization present in Data wrangler that you get for free. For instance, to show outliers in the data in a histogram. This in combination with the UI driven data cleaning could increase the speed of the data science work as 80% of the time is spend in data exploration/cleaning.
Protocols in Python: Why You Need Them
speaker: Rogier van der Geer
TOC
1 Dynamic / static typeing
2 type hints
3 ABCs
4 Protocols
1, Python is a dynamically typed language, what does that mean? Types are checked at runtime, types declarations are not required. This is in contrast with statically typed languages. The concept of duck typing is illustrated by the classic example of classes that are interchangeable as long as they support a minimal set of required methods.
2, Optional static typing, which can be combined with mypy for static type checking and runtime errors. We illustrate this by constructing a general "eat_bread" function that accepts an argument with a typehint that is a Duck or a Union of a Duck and Pig. It shows that we can roughly make generic functions that could be compatible with a specified set of types, which can be checked by mypy. But what if want to make this function generic, without specifying each acceptable input parameter type.
3, Abstract base classes can define a blueprint for all animals that can walk, fitting with our example. We can let all our specific animal classes inherit from our animal abstract base class (ABC), which is a requirement as an ABC class can not be used directly. ABC classes are not easy to expose from inside a library that you import. It does however works to define a set of required methods which raise NotImplementedError, which require an implementation in each subclass. It is still hard to manage common ABC classes across different python packages. Although you can register this with the ABC.register method, which feels a bit hacky due to its indirection and monkey patch nature.
4, Protocols solves our challenges around implementing generic behavior more elegantly. A class inheriting from Protocol defines methods and attributes that are required to be perceived as a instance of that class. Any class that defines at least the methods and attributes that match the protocol subclass will be considered as subType of Eatsbread. At runtime objects instance checks do not respect this implicit sub typing, not without adding the runtime_checkable decorators. Protocols behave like ABC classes as they can not be instantiated and are not part of the super() chain of runtime inheritance management. I hope I have convinced you that we need protocols.
Event-driven microservices with Python and Apache Kafka
speaker: Dave Klein (confluent.io)
We focus on event state transfer where the event has a payload and we can call them messages. This approach is valuable for building micro services. Confluence includes founders of kafka, therefore we will explain basic kafka workings. events have a key and a body in bytes, commonly contains json or avro data. The events are written to linear logs called kafka topics, which consist of partitions. Each partition has an ordered set of events, but order is not consistent across partitions. The producer writes the events to the log with two main libraries for Python: kafka-python, confluent-kafka-python. The consumer reads events from the topics. The producer and consumer do not coordinate. It is the consumer that maintains an offset to know where it was during restarts. A schema registry contains schemas that coordinate what data to expect and write by consumer and producer. Consumer groups can manage the offset for a set of consumers so that each application instance get unique events.
kafka event processing is proposed to an alternative tot a mesh of http REST microservices to keep the architecture more clean. Both approaches can be used mix-and-match. consumers can be added without affecting other consumers as long as they maintain their own index (consumer group).
What happens when you import a module?
speaker: Reuven M. Lerner
We write pseudocode that matches the import behavior of Python. Imports assigns the imported to global variables. One insight is that a partial import does not mean we do not import the base module.
```
from random import randint # it imports random fully, but does not assign it to a global
```
Python globals only live on the module level. Modules are imported by executing each line, this has implications for what makes sense to write in a module. In that sense Python does not load a module but executes it.
Working with Audio in Python (feat. Pedalboard)
speaker: Peter Sobot (Spotify)
Digital audio is a stream of floating point numbers (uncompressed 64bit floats, 21 Mb / min). Uncompressed fixed point (around 10 Mb / min). Compressed audio goes down to around 1Mb / min, but this requires online decoding for processing.
Reading and editing audio with Python with Pedalboard.
```
from pedalboard.io import AudioFile
with AudioFile("my_favourite_song.mp3") as f:
print(f.samplerate)
f.read(3) # read 3 samples
```
Shape of returned array is (2, 3) for stereo sound. Array slicing syntax can be used for these audio arrays. Numeric indexes do not mean much for audio we need use f.samplerate to select ranges of time. We will work a slapback delay. We compute a delay x based on time times samplerate. We iterate over our array and add samples of x samples back times a volume factor (to not clip our audio). This can also be understood as adding two arrays with one array shifted x samples forward. I am not sure why the presenter gave examples using for loops for manipulating arrays.
Audio can be large in memory after decoding. A basic approach is to chunk the audio as it comes in and process it. Seems a good fit for a generator, although the speaker shows a while loop. Python is slow therefore numpy and pedalboard exist which run operations in c mapped across arrays optimized in memory.
VST plugins can be loaded with Pedalboard to apply them to audio from Python. Streaming support exists as a pull request and might make it possible to do some limited integrations with other audio software.
Day 2
PyArrow and the future of data analytics
speaker: Alessandro Molina
PyArrow implements 90% of what is available in Arrow itself. The PyArrow Array are similar Numpy array with no cost of conversion between the two. The array support nested datatypes including all the data, not via references to the python objects such as dictionaries. This lack of references increases the change of computational optimization in memory, especially vectorized operations. Any value can be defined as a missing value, using a validity map. We are thus guaranteed to have a single continuous memory buffer with all values, increasing computational optimization.
Besides data representation pyarrow also supports operations to manipulate data. Examples are array element-wise multiplication as explicit function call. We are considering support syntactic sugar similar to numpy, but for now we have explicit functions for manipulations.
````
import pyarrow as pa
arr = pa.array([1, 2, 3, 4, 5])
pa.multiply(arr, 2)
````
PyArrow Tables
Arrow was born as a columnar format. Tables are actually constituted by pyarrow.chunkedArray so that appending rows to them is a cheap operation Here PyArrow is similar to pandas DataFrames. Appends do not affect the current memory layout which is more optimal to pandas dataframe that have to be fully copied on appends. The Acero compute engine supports many dataframe related operations such as joining filtering and aggregation. PyArrow tables have a schema with a type per column that can be build from pyarrow arrays or python lists with a list of column names.
If you are already using numpy or pandas than you can easily move to pyarrow with the zero copy data conversions that are provided. The design goal was to support interoperability without conversion overhead. Many systems support arrow with Spark, pandas and numpy being the most relevant. Data conversions is helpful, but it might be worth using the pyarrow compute engine direct as well. It is often faster than the pandas or numpy operations. Other than using pyarrow direct we can use it as an explicit backend for pandas when reading data.
```
pd.read_csv("example.csv", engine="pyarrow")
```
Laziness with PyArrow Datasets.
Pyarrow provides Datasets with lazy access to avoid the need of loading it all in memory at once. Datasets are supported by the Acero compute engine in most cases in place of tables. The Dataset API combines file formats, different filesystems (local, cloud) with a DataFrame API and a query engine. PyArrow manages much of the data loading multiple files into partitions. The API for datasets is a subset of the tables API, but does support some core filtering, projecting and joining. Conversion to Tables is possible to get the full API. PyArrow provides more such is Arrow Flight that manages data exchange between client and servers. Data writers to dump data to different file and message formats.
Scaling scikit-learn: introducing new sets of computational routines
speaker: Julien Jerphanion
New sets of computational routines for scikit-learn developed by the originating company of scikit-learn. We want to improve what exists, instead of adding shiny new features. On of the improvements is performance. There is a performance gap with other cutting edge machine learning libraries. The focus is to improve the key operations in scikit-learn, so that a broad set of library methods benefit from the speed improvement.
Case of k-nearest-neighbors with the brute force approach. Partitioning of a matrix around kth smallest value (pivot). This is done in numpy with nap.argpartition, np.argsort. This will crash your computer as it does not fit in RAM. So we can create sets of vectors and vectorize our operations in parallel with joblib. A lot of overhead costs in this parallel operation is the PyObject conversions and the GIL. Chunking strategy is sub optimal as it creates temporary arrays that create extra costs. Python is a bit simplified missing buildin support for various distributed commands. We circumvent the GIL with cython, as long as we annotate our python with extra type information.
Our target audience mostly uses laptops to train our models. Which have CPUs with multiple cores each with dedicated cache storage at 3 layers. We need to reduce the movement between RAM and the outer L3 cache. Combined with low level parallelism with OpenMP (via Cython) and optimized linear algebra libraries such as BLAS level 3 operations. With this combination we can get approximately linear speed increases as the number of cores (threads) increases. At high amount of cores we lose some advantage to overheads.
How can we measure our improvements of each of our improvements. We use perf which allows us to profile our solution in CPU cycles per operation. If we look at the time spend in the core operation most of the time goes into vectorization where we apply the same operations on multiple floats at the same time, which shows that the solution is efficient. When we look at the cache hit and misses. We see much more cache hits, which shows we do not do unnecessary swaps of data between RAM and L3 cache.
The chunking approach can be applied to various scikit-learn functionality which then benefit from the parallelization. Our library is organized as a hierarchy of classes where we share benefits of optimizations of parent classes to any subclasses. Future work is to hardware specific computational routines that could be extended to various hardware setups supporting various hardware vendors with an open design.
How do you debug? Print statements :) Duck debugging, talk to the duck and explain your code. Pysnooper from a talk of yesterday can improve your print statements. Of course, we can use debuggers like pdb. We need to step through our code until we find the line that causes our error.
In Python we write asynchronous applications with asyncio running an eventloop. ayncio provides us a debug mode, for 1 finding non awaited coroutines, 2 many non-threasafe ayncio API and more. We can enable the debug mode via an evnironment variable, passing a cmd parameter, calling the eventloop with debug true. Debug mode is verbose and prints updates from the eventloop and you can set threshold to filter coroutine execution duration.
Debugging asynchronous programs in Python
speaker: Andrii Soldatenko
Python is an interpreted language with a REPL for interactive programming. The problem is that currently you can not use asyncio await within the REPL, it is a known issue. The fix has been merged to bring an alternative REPL that supports asyncio await. IPython REPL already has this feature with some hacks and supports await. If you use jupyter this also holds, as it uses the ipython kernel underneath and adds setting breakpoints.
debuggers, pdb defines a interactive debugger that responds to the keyword "breakpoint()". It will pause on the breakpoint and allows stepping through the code and execution state. pdb is pretty limited so we have pdbpp and ipdb. with rich graphical interfaces. ipb supports hooking into the breakpoint buildin keyword
```
export PYTHONBREAKPOINT="ipb.set_trace'
```
The problem is that these debuggers do not support asyncio await. Asyncio does not allow the eventloop to be nested. When you want to await something in the debugger you want to run something on top of a eventloop that is already running, this is not allowed. There is a workaround however, if we pip install nest_asyncio, which allows us to execute an awaitable function within the debugger by getting the current eventloop and run it to completion, using this patched nest_asyncio eventloop.
If we are on Docker or kubernetes you can always see your asyncio logging. We have aiomonitor that you connect via an http port which communicates the log messages with asyncio tasks. Lastly we have aioconsole that is a REPL like that can await dor debugging.
Deadlocks are problematic where two coroutines require each other to finish. This can crash out of memory with a recursive error. How can we handle asyncio deadlocks? We can have a deadlock detector, but we do not have one in Python. The speaker shows a bit of code to break deadlocks by cancelling tasks that take too long.
awaitwhat can show you what is currently active in the eventloop with a chain of coroutines that shows you the chain of various dependencies to find routines that are stuck and buggy.
aiodebug allows callbacks to print when coroutines are running longer than a certain threshold, which you can monitor and represent in graphs for production purposes
Day 3
Jupyter - Under the Hood
speaker: Dhanshree Arora
A notebook is stored as a JSON map with arrays of cells. the notebook client is responsible for starting the kernel and communicating this with the notebook server. The server includes a lot of functionality that can be extended with plugins for interacting with the notebook. Communication runs on the jupyter messaging protocol based on ZMQ. This standardized protocol prevented people of reinventing the wheel. It supports a number of socket types and patterns. Standard request and reply mapped on two dedicated sockets. This pattern ccan get stuck in a receive reply cycle and does not have fair queuing. Publisher-subscriber model where sockets represent topics where you can subscribe to. Dealer and Router socket pattern the router and dealer can receive messages and forward them without processing them. The router can see who listens and can implement fair queuing.
Jupyter needs the publisher-subscriber and the dealer-router patterns. dealer-router is implemented in both directions between client and server. The router in the ipython kernel can send requests to the frontend and visa versa. For instance, a virtual keyboard binding requesting a prompt from the user. The normal direction is the frontend requesting the executing a cell from the kernel.
We can create a notebook programmatically and link it to a kernel session with a http request, which will start the session. After that we can use an AsyncKernelClient to interact with the session to print info or interact it in various ways. This is mostly aimed to do custom session management. Kernels can be predefined with kernel specs in the local directory. Any number of sessions can be started from the same kernel spec. Normally a notebook connects with one session, but using the lower level you can send execution requests to different kernels from the same notebook. The eco-system is still expanding by adding stuff on top of the basic components.
Why is it slow? Strategies for solving performance problems
speaker: Caleb Hattingh
A lot talks are about how to improve performance, but not a lot of talks are about how to diagnose performance. 1) fundamentals we need to think about, 2) when it is easy to run, 3) when coe execution is hard 4) distributed systems.
1 fundamentals, It is important to understand why a system is slow. You must have a good overview of what the system is doing while a performance issue is found. We need to figure out why the system is slow by looking beyond specific lines of code. There are various scenarios during discovery, cache it, remove it while trying to go for big improvements instead of micro gains. For this we need the call stack to allow inspection of the behavior. For this we need tools. I will give a short list of what I use at work based on simplicity and impact. We need to select the tools that give us the information we need, in this the class tack.
2 When code execution is easy (such as local execution) it is possible to run parts of the program and rearrange things during tests. We can write unit tests specifically to investigate performance issues. simplest approach is Ctrl+C during the running of the program within a test. This will give you a stack trace which is almost always the same and might indicate where the program is stuck. This is named stack sampling. This seems too simple to work, but experience shows it is very effective. Compared with cprofile we can see the bottleneck in both, but we can not see the order of the call stack in cprofile which is easy to see in the Ctrl+C stacktrace. Cprofile is pretty expensive and measures everything. The numbers in the output are so detailed that might lead you to do micro improvements, rather than rethink your design. Pytest-profiling adds a flag to pytest to enable profiling --profile-svg. This svg shows a graphical map of your function calls with their runtime cost in colors enriched with statistics. It also shows the function call stack relationships as edges between the blocks in the figure. Do keep in mind that it is much more expensive compared to Ctrl+C.
3 Py-spy is my magic choice that is a sampling profiler that can be used in production environment that has a small performance impact. It can include stacktraces from native extensions inside your python stacktrace. It has a record command that dumps an svg file and allows you to include subprocesses. It gives a very rich graphical representation of what was called with their costs. you can attach py-spy to running processes with top, which returns a table of lines and their run statistics. The dump command is really useful it dumps a list of all the call stacks for both test and production processes showing information for all threads.
4 distributed systems focus us on just a few options we have to diagnose performance. running code at will is very hard and slowness might only happen sometimes based on rare interactions. Still, the same rule applies we want a call stack that operates across distributed systems. We ideally would want it be ordered based on the execution. Distributed tracing is the name for our requirements. There are many vendors where we choose Honeycomb. The key information from a distributed trace is the temporal dependencies between systems and their runtime costs, where the current systems changes as we go down the trace in time. There is a cost to this as data needs to be collected continuously where all data needs to be transferred to a centralized server for visualization. We need to add snippets of code to each of our services to send the relevant traces to our tool.
Clean Architectures in Python
speaker: Leonardo Giordani (author of clean architecture in Python)
I want to share my views on system design and my learnings. What is the definition of architecture? we mention it many times when talking about systems. Vitruvius (15 BC) indicates it is about durability, utility and beauty. How often do we think about our code in these terms. We change frameworks every few years? is it beautiful? which is my main concern. Engineer comes from engines, but engine comes from ingenuity (latin), so it is less about mechanics and more about solving problems in a clever way. I found some more sources to define architecture which I merged into the art and science in which the components of a computer system are organized and integrated. how often we think about our work as science and art? When do you look at your code and think about art? why can our code not be beautiful? organization of a system is about where components of the system are and how are they related. With this definition do we need it?
When we create a library do we create only something mechanical or we create something that makes the experience better? Linux was well designed from a user perspective and based on Unix created 50 years ago. I am not alone I show a list of books that I recommend. The introductions of these books already give you a narrative to think about when designing systems. It is interesting that message based systems and object oriented programming are both about messages. OOP is about objects exchanging messages by calling each others methods.
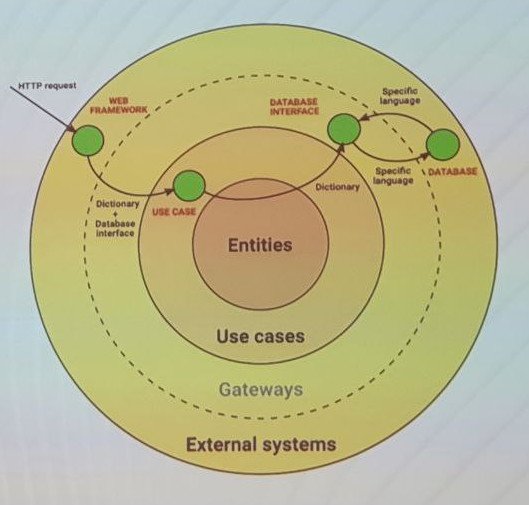
So what "clean" in clean architecture. It is easy to define the opposite of clean, not tidy, unmaintainable, spaghetti code. In a tidy system we know where what and why it is in system. Clean architecture is layered architecture that was introduced by Robert Martin, talks about concepts that pre-dates his work. The layered approach structures software in a circular fashion. Traditionally we have four layers: External systems, Gateways, Use cases, Entities. A component can only see definitions in the inner layers and communicate inward with simple structures (defined in inner layers) and outward through interfaces (defined in inner layers). In Python we have protocols and ABC classes to fit our interface needs. Our example is simple, it is valid Python, but it is stripped. Use case is to retrieve a list of items. The function that gets an item is defined in the use cases layer. Out items are entities and defined in the entities layer. External systems requires a web framework to expose an API (here flask), business logic is what you market, the core of your application. The web framework is not part of the business logic and can live in the external systems layer. The core business logic lives in the use cases layer. We communicate with simple structures in our case a dictionary, whatever is available in the core language. We should not communicate with anything that is related to our web framework or http requests. Data is store in a Data repository and can be a database like system, flat filesystem or external API, etc. The data repository and the data repository interface are implementation detail and not part of our business logic. The use case is not allowed to communicate directly with the database, it should not be tightly coupled with it, so we need the database interface that abstracts the data repository specifics. The data repository interface is a gateway and lives in the gateway layer. We use dependency injection to pass the database interface into the use case functionality along with our simple data structure. Finally, we can talk about our business logic. Eventually, we need pass the external system request parameters into the database interface that filters our objects as a list. The business logic might be mainly cleaning up the request parameters.
Secure Python ML: The Major Security Flaws in the ML Lifecycle (and how to avoid them)
speaker: Alejandro Saucedo
This talk is a call to action to explore the best practices. It is impossible to make systems fully secure, but it is possible to mitigate undesired outcomes. The technical solutions still rely on humans and are open to social engineering. MLSecOps is an extension of DevOps adds extra security requirements on top of what is required with DevOps. We are sprinkling the machine learning and complex data flows on top of the typical complexity of IT systems. Challenges are about reproducibility, stability and consistency. We will map the classic OWASP top 10 concept onto our machine learning solutions. This talk is not specifically about machine learning deployment, but we will be training, packaging, deploying/inferencing a mchine learning model.
We use MLServer based on FastAPI with a scikit-learn model on the IRIS data set (LogisticRegression). We will persist our model with joblib and have a look into this binary to see the familiar header which describes the module we will need to load to instantiate the model. We deploy this model behind an API. Actually much of the work starts after deployment as the lifecycle starts. Every step of the lifecycle is susceptible to hacks, so we will have to decide what are high impact issues. Some duplicate content regarding security concerns around using pickle for model serialization. What should we do? Best practices is to have a zero trust architecture. If the attacker has access to the models they can do various deeper attacks to manipulate the model output. For instance, adversarial modelling to introduce exceptional output from the model and replace the original. Dependencies can have risks in their supply chains as it is hard to verify first, second or third order dependencies. Poetry allows you use lockfiles, but these are not always respected, such as python wheels. We can do scans on Python dependencies and docker images. These kind of risks extend into the underlying runtime, such as kubernetes.
We created a EthicalML/sml-security cookiecutter on github to give people a good start with the security posture of a machine learning project. The base project has a base server, dependency package management, dependency scanner, model versioning.